NUGEN Audio VisLM
- February 14, 2022
- by Steve Castellano
- Product Intelligence Report
An engineer friend of mine has a favorite saying: “The great thing about standards is that there are so many to choose from.” It’s a statement that might as well have been written about loudness measurement. An understanding of the principles of loudness measurement and standards is essential for anyone who’s involved in digital audio these days, and in particular the loudness specifications of the medium or service they’re producing audio for. And while these services all use the same standard of measurement, their targets, or recommendations, may vary significantly.
One metering solution to rule them all
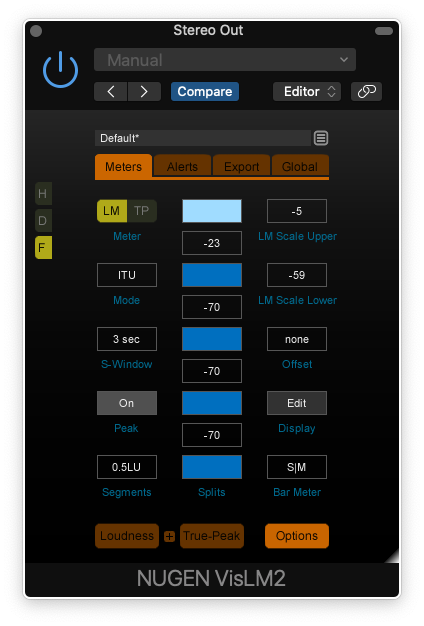
NUGEN Audio VisLM is a highly configurable metering solution for audio loudness management that’s easy enough for a novice to use “out of the box,” while still offering a full complement of options to meet the needs of professional broadcast and post audio applications. It includes a variety of presets configured to international broadcast standards, and tabbed options palettes which will allow you to create and save presets based on your own application.
VisLM is offered both as a plugin in 64 bit AAX, VST, VST3, AU, AudioSuite and 32 bit RTAS versions, as well as a stand-alone application that can be used to monitor your computer’s ASIO inputs, and supports up to 7.1.2 surround sound. But before we dive any further into how it works, I’ll try to give you a quick synopsis of how and why loudness measurement became so important – and how all these disparate targets came about.
The loudness problem
The history of modern loudness regulation is a short but complicated one. The simple principle at work is that something that’s loud is more likely to grab a listener’s attention than something is that is less loud. And due to the way humans perceive sound, it’s possible to make a recording sound more or less loud without changing the overall amplitude – largely through the use of compression.
This set the scene for the “loudness wars,” which saw increasing amounts of compression in commercial audio recordings as labels and producers fought for listeners’ attention over the airwaves. It is also the principle at work when you would, once upon a time, find yourself drifting off to sleep while watching a late-night movie, only to be blown off the couch by the volume of the next commercial.
Public outrage over the latter phenomenon eventually resulted in the Commercial Advertisement Loudness Mitigation (CALM) Act being passed in the U.S. in 2010, and the development of the EBU R 128 recommendation by the European Broadcast Union in the same year. But in order to regulate something, you need to be able to measure it. And in the case of perceived loudness, which is by definition subjective, the task of accurate and consistent measurement is a tall order.
The solution involves a lot of math that is beyond my comprehension, and if you’re interested, it’s described in detail in a document called ITU-R BS.1770-4. But while a consensus was reached on how to measure loudness, there’s no single standard that can reasonably be applied to all media. And beyond the inevitability of broadcast standards being established by national regulating bodies, individual online streaming services were free to set whatever loudness recommendations they felt worked best for them.

The big picture
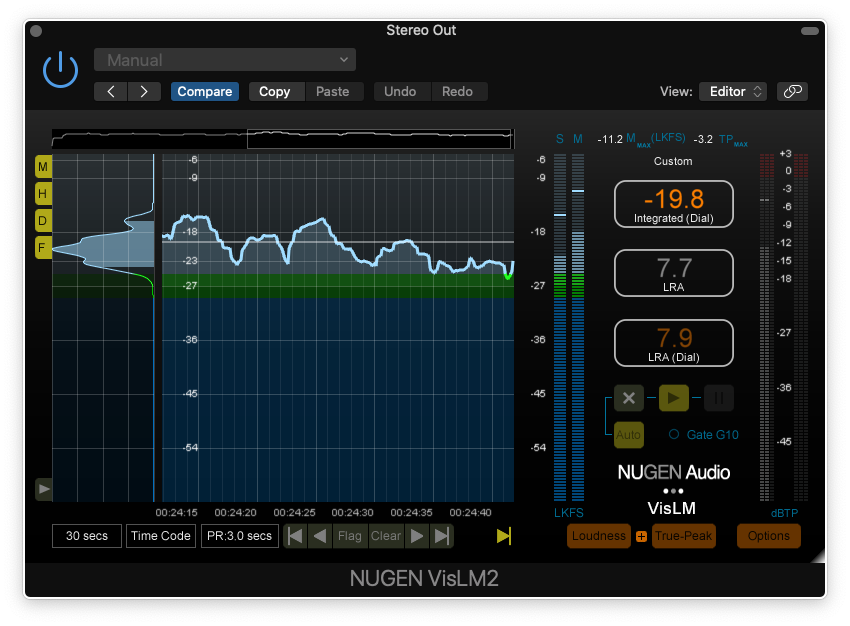
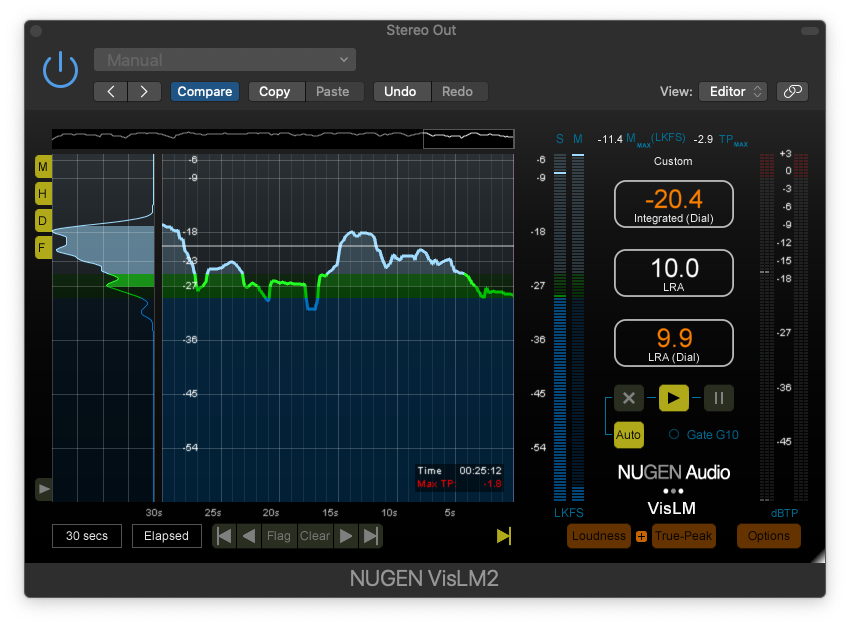
Loudness recommendations encompass a few different measurements. The primary loudness measurement is Loudness Units Full Scale, or LUFS (Loudness K-weighted Full Scale, or LKFS, is basically a different term for the same measurement). To further complicate matters, while standards may be concerned primarily with Integrated LUFS (the overall loudness of an entire program), they may also include a Maximum Short Term recommendation. You will also see a Maximum True Peak number and, in some cases, a Maximum Integrated Dialogue measurement.
This is a lot of measurement to keep track of, and VisLM does a great job of keeping it organized and easy to parse. The plugin window expands to incorporate whichever views you’ve selected: Loudness and True Peak are displayed with numerical readouts and vertical meters. The history display expands to the left when selected, offering a graph that displays the momentary loudness readings against time. Distribution, a visual representation of loudness over the duration of the material, is displayed on the far left.
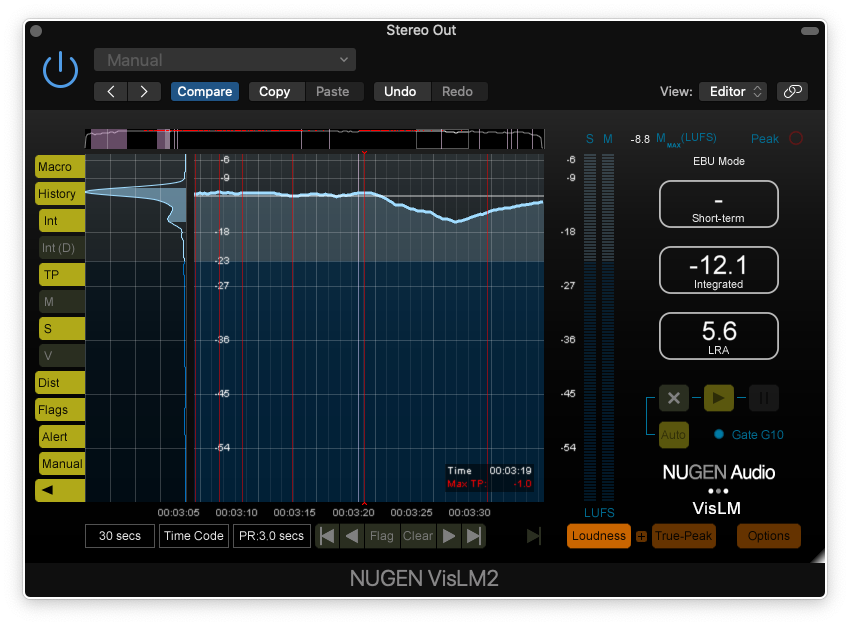
Loudness history in colour
VisLM does a great job of creating a useful visual representation of all this data. The history display can be divided into up to four zones with user-selectable colours, so that you can see at a glance if and when your loudness is near or outside of your prescribed recommendations. When an alert is triggered. a flag is dropped in the history view, represented by a vertical red line.
Navigation controls allow you to quickly skip from one flag to the next so that you can view the readings from each specific instance. You can also create flags manually, to identify problematic areas for follow-up later. This history display locks to time code, which means you can go back and correct isolated sections of your audio and re-measure them without having to re-analyze the entire track – saving you time when dealing with longer program material.
Finding inner peaks
One of the least intuitive concepts I came across when diving into loudness measurement is that of Inter Sample Peaks, sometimes abbreviated as ISPs. The idea that there might be peaks over 0db hiding between my samples was tough to get my head around. But when I examined a few tracks with VisLM’s True-Peak Metering function, it turned out they were happening more often than I would have thought.
ISPs will likely be inaudible while monitoring in your DAW, but can cause distortion when converted to MP3 later on. The simplest way to visualize what’s happening is to think of your samples as plots on a graph, and the digital-to-analogue process as drawing a smooth line to connect the dots. If you have two consecutive samples at or near 0db, this can result in that line being drawn over 0db, which shows up as clipping in your final product.
VisLM makes these peaks easy to spot, through the True-Peak meters, a True-Peak overload indicator that will light when peaks reach a pre-selected threshold, and flags in the history view.
Conclusions
VisLM does an excellent job of making the complex task of loudness management comprehensible and intuitive. The included presets cover a wide range of industry standards, including a dedicated Netflix preset, and these together with the extensive customization options make it a clear choice for anyone who needs to deliver audio to one or more loudness specifications.
Even if your production workflow doesn’t demand strict adherence to loudness guidelines, VisLM can be a valuable tool to help you identify potential issues when producing digital audio. The True-Peak meter in particular was a revelation for me, and it’s likely earned a regular slot on my master bus.
Author

Steve Castellano
Steve Castellano is a musician and writer living in Toronto, Canada. He holds a music degree from York University, where his focus was electronic music and composition. He currently records and performs modular electronic music under the name Elettronica Sperimentale.